Table of Contents
Enable API Debugging
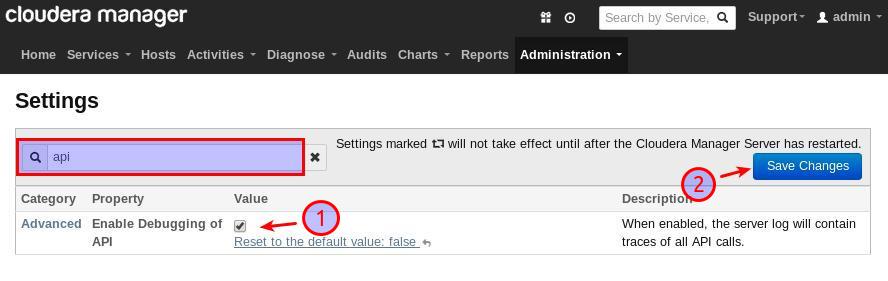
The CM server has a setting to turn on API debugging. Go to the Administration Settings page, and check “Enable Debugging of API”.
This makes the server logs all API requests and responses, with HTTP headers.
You can view the server log under Diagnose -> Server Log. Or you can find it in
/var/log/cloudera-scm-server/cloudera-scm-server.log.
 In older releases, the settings page is under the gear icon at the top right corner.
Inspecting HTTP Calls
Here is a snippet of one request’s log:
2013-09-05 22:22:32,771 DEBUG [877045565@scm-web-138:api.LoggingInInterceptor@50] API request:
---------- id: 2
GET /api/v4/clusters/Cluster%201%20-%20CDH4/services/HDFS-1/roles/
Encoding: UTF-8
Authentication: admin [FEATURE_BDR, FEATURE_CONFIG_HISTORY, FEATURE_ENTERPRISE_SUPPORT, FEATURE_KERBEROS, FEATURE_LDAP, FEATURE_NAVIGATOR, FEATURE_OPERATIONAL_REPORTS, FEATURE_PEERS, FEATURE_ROLLING_RESTART, FEATURE_SNMP, ROLE_ADMIN, ROLE_USER]
Headers:
    Accept=[*/*]
    accept-encoding=[gzip,deflate,sdch]
    Accept-Language=[en-US,en;q=0.8,zh-CN;q=0.6,zh;q=0.4]
    Authorization=[Basic YWRtaW46YWRtaW4=]
    Cache-Control=[no-cache]
    connection=[keep-alive]
    content-type=[application/json]
    Host=[nightly47-1.ent.cloudera.com:7180]
    User-Agent=[Mozilla/5.0 (X11; Linux x86_64) AppleWebKit/537.36 (KHTML, like Gecko) Chrome/28.0.1500.95 Safari/537.36]
Note the line GET /api/v4/clusters/..., which helps you translate a method
call in the Python or Java client to the underlying REST call.
The log for the corresponding response is:
2013-09-05 22:22:32,831 DEBUG [877045565@scm-web-138:api.LoggingOutInterceptor@101] API response:
---------- id: 2
Response code: 200
Content-Type: application/json
Headers:
    Date=[Fri, 06 Sep 2013 05:22:32 GMT]
Body:
(message truncated to 4096 bytes)
{
  "items" : [ {
    "name" : "HDFS-1-DATANODE-772ca180f95a313f3fffed989535b83d",
    "type" : "DATANODE",
    "serviceRef" : {
      "clusterName" : "Cluster 1 - CDH4",
      "serviceName" : "HDFS-1"
    },
    "hostRef" : {
      "hostId" : "nightly47-3.ent.cloudera.com"
    },
    "roleUrl" : "http://nightly47-1.ent.cloudera.com:7180/cmf/roleRedirect/HDFS-1-DATANODE-772ca180f95a313f3fffed989535b83d",
    "roleState" : "STARTED",
    "healthSummary" : "GOOD",
    "healthChecks" : [ {
      "name" : "DATA_NODE_BLOCK_COUNT",
      "summary" : "GOOD"
        ... omitted the rest ...
Note the id: 2, which matches the response to the request. The body can help
you determine what is really happening, before the any post-processing by the
client libraries.
Development Tools
Browser Tools
The following browser plugins let you easily make calls to the API, and iteratively work on a sequence of calls to achieve some higher level function.
- Postman - REST Client for Chrome.
- RESTClient for FireFox.
Python Tools
We highly recommend the using the IPython shell instead of the regular Python shell for development.
$ pip install ipython
$ ipython
You will be greeted by a shell. Everything that works in a regular Python shell works here. In addition, the IPython shell gives you wonderful features like tab completion, which lets you easily find out the available methods and attributes of an object.
The IPython shell can also debug your API scripts, show you documentation, reload any imported modules, etc. See this short tutorial for more details.
If you use IPython, you may also want to look into ipdb, which lets you insert breakpoints into your script, or launch your script in a debugger.